Cyprus Macros
The Cyprus Real Estate Market Analysis report for 2020 in Greek can be downloaded here
The Cyprus Real Estate Market Analysis report for 2019 can be downloaded here
GROSS DOMESTIC PRODUCT (GDP)
In March 2013, the Cypriot economy experienced a financial crisis resulting in the haircut of the deposits held by the two largest commercial banks of the country; it was the first time such an occurrence took place globally. The subsequent negative political-economic developments almost led to the collapse of the local financial sector as a result of a domino effect, which resulted in a direct adverse impact on the property market. However, the climate created by this financial turmoil has been now reversed with the country witnessing strong growth since 2015 as a result of significant reformations that resulted in the improvement of investor confidence.
The GDP of Cyprus reflected the situation of the local economy, since the strong increase of 2006-08 was followed by a 6-year unstable period where the national output contracted significantly with the peak negative years of 2012 (-2.9%) and 2013 (-5.8%). 2015 was the year of recovery and since then the local economy demonstrates strong year-on-year growth, which is among the highest in Europe. In 2015, the Cypriot economy grew by 2%, followed by a strong increase of 4.8% in 2016 and an equally strong growth in 2017 (4.2%). It is predicted that it will keep growing, however at a slower pace, by 1.9%-3.8% annually over the period 2018-2023.
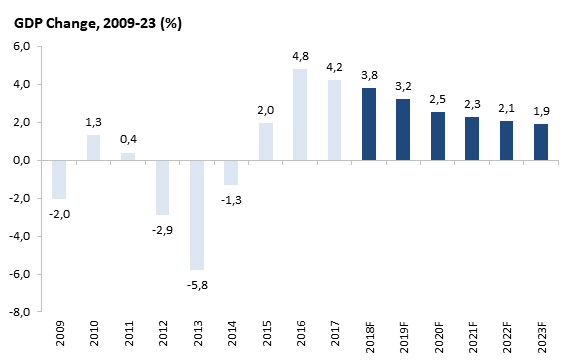
Source: Focus Economics
TOURISM SECTOR OVERVIEW
The tertiary sector of the country (Services) comprises the most important productive sector of the Cypriot economy, with tourism holding the prominent position. In 2017, tourism contributed 13.5% on GDP and justifies its role as the steam engine of the local economy. The following graph presents the tourism receipts and their share on GDP for the period 2013-17, which show steady increase from 11.5% in 2013 to 13.5% in 2017.
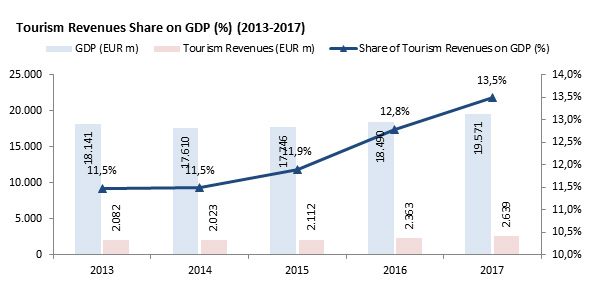
Source: CYSTAT, Focus Economics
There were c.3.9m tourist arrivals recorded in 2018, another record-high for Cyprus, which is c.8% more than the previous record year 2017 (3.7m arrivals). Since 2014, we notice strong yearly growth which is due to a combination of the overall recovery of Cypriot economy and the image of the country, but most importantly it is due to the turmoil in the nearby Middle Eastern countries. Tourist arrivals in Cyprus almost doubled during the last 10 years (2.2m in 2009 vs. 3.9m in 2018). The following graph illustrates the tourist arrivals in Cyprus and the annual changes for the period 2008-2018.
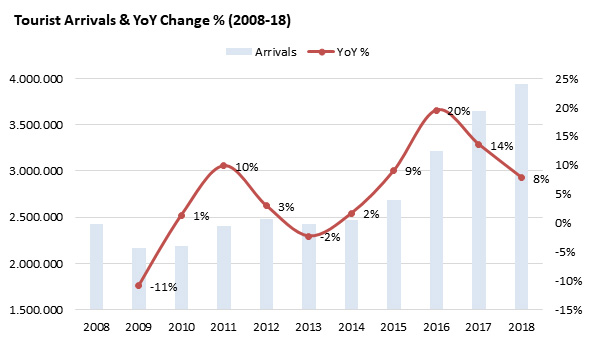
Source: CYSTAT
For more details please contact us.
Nicosia
Number of Transactions
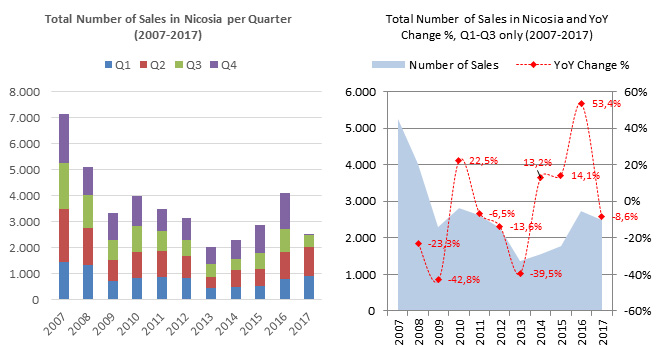
The total transactions (including transfers and exchange of contracts) in Nicosia were c.4,100 in 2016 significantly higher compared to 2015 (44%), an impressive 103% increase from the lowest point of the last decade (in 2013 – c.2,000 transactions), however, still 43% lower than the peak year in 2007 (c.7,150 transactions) (the graph shows a decrease as 2017 data are do not include Q4 which is typically the best in terms of number of sales).
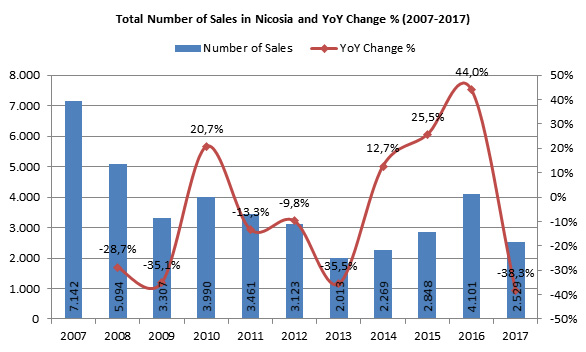
Source: Department of Lands and Surveys
The following graph (left-hand) shows the breakdown of the total transactions per quarter in Nicosia where we can see that, especially after 2013, Q4 is the best performing quarter of the year in terms of number of deals. The right-hand graph shows the total transactions of Q1-Q3 in each year, where we observe that Q1-Q3 in 2017 is 8.9% lower than the same period in 2016 (due to the capital gains tax exemption and lower transfer tax that had an initial expiry date 31/12/2016).
Source: Department of Lands and Surveys
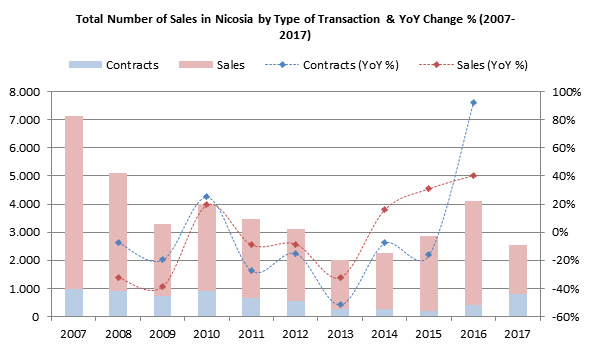
Total Transactions by Transaction Type
After the bottom year of 2013, there is a steady increase of deals year on year for Sales which mainly refer to resales compared to a negative growth of new-build properties / projects as reflected by a reduction of Contracts. Interestingly, in 2016 there is a big increase of contracts which is mainly due to a number of new projects that came into the markets, such as the Cyfield 360 and the Central Park Residences, as well as greater confidence in the market and the economy.
Source: Department of Lands and Surveys
For more details please contact us.
Larnaca
Number of Transactions
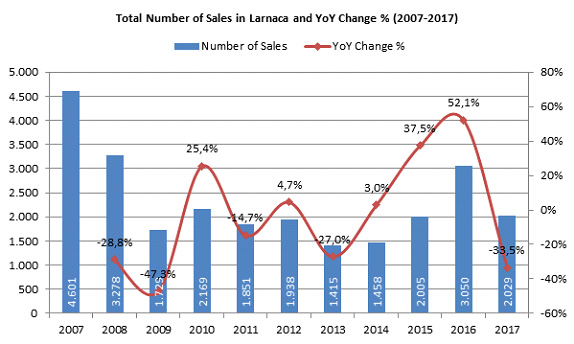
The total transactions (including transfers and exchange of contracts) in Larnaca were c.3,000 in 2016 significantly higher compared to 2015 (52.1%), an impressive 116% increase from the lowest point of the last decade (in 2013 – c.2,000 transactions), however, still 34% lower than the peak year in 2007 (c.4,600 transactions) (the graph shows a decrease as 2017 data are do not include Q4 which is typically the best in terms of number of sales).
Source: Department of Lands and Surveys
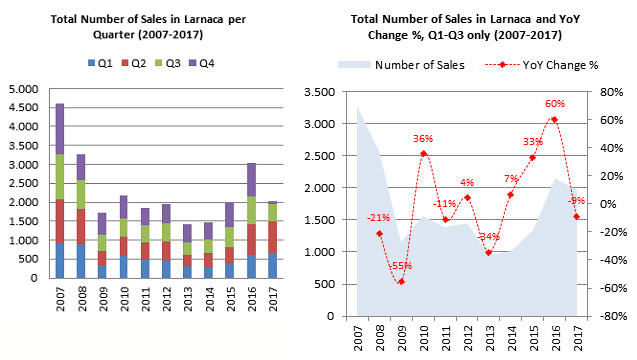
The following graph (left-hand) shows the breakdown of the total transactions per quarter where we can see that, especially after 2013, Q4 is the best performing quarter of the year in terms of number of deals. The right-hand graph shows the total transactions of Q1-Q3 in each year, where we observe that Q1-Q3 in 2017 is 9% lower than the same period in 2016 (due to the capital gains tax exemption and lower transfer tax that had an initial expiry date 31/12/2016).
Source: Department of Lands and Surveys
For more details please contact us.
Limassol
Number of Transactions
The total transactions (including transfers and exchange of contracts) in Limassol were c.5,200 in 2016 significantly higher compared to 2015 (61.1%), an impressive 156% increase from the lowest point of the last decade (in 2013 – c.2,000 transactions), however, still 18% lower than the peak year in 2007 (c.6,280 transactions) (the graph shows a decrease as 2017 data are do not include Q4 which is typically the best in terms of number of sales).
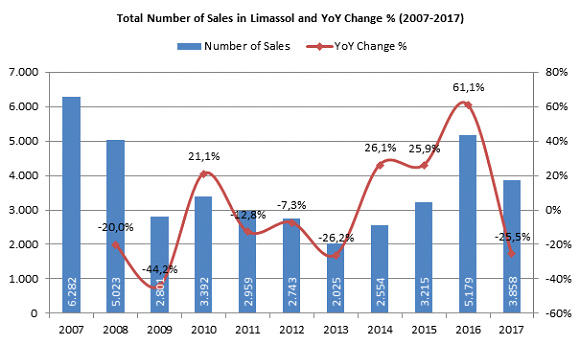
Source: Department of Lands and Surveys
The following graph (left-hand) shows the breakdown of the total transactions per quarter where we can see that, especially after 2013, Q4 is the best performing quarter of the year in terms of number of deals. The right-hand graph shows the total transactions of Q1-Q3 in each year, where we observe that Q1-Q3 in 2017 is 10% higher than the same period in 2016, which is mainly attributed to Limassol being the best performing market in Cyprus with an incredible influx of foreign buyers who are mainly targeting the Citizenship (properties over €2m).
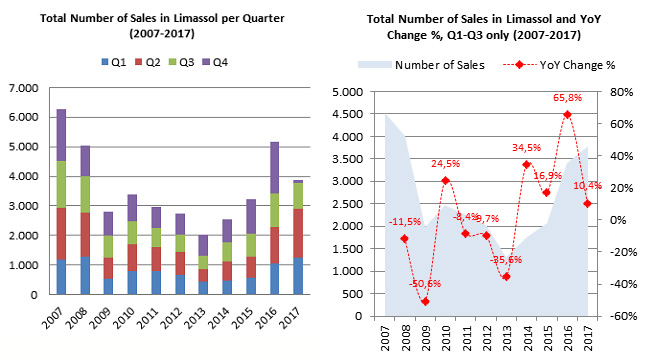
Source: Department of Lands and Surveys
Total Transactions by Transaction Type
After the bottom year of 2013, there is a significant increase of deals year on year for both Sales and Contracts. Interestingly, in 2016 there is a big increase of contracts which is mainly due to a number of new projects that came into the market (e.g. ONE Limassol, Del Mar and others) as well as greater confidence in the market and the economy.
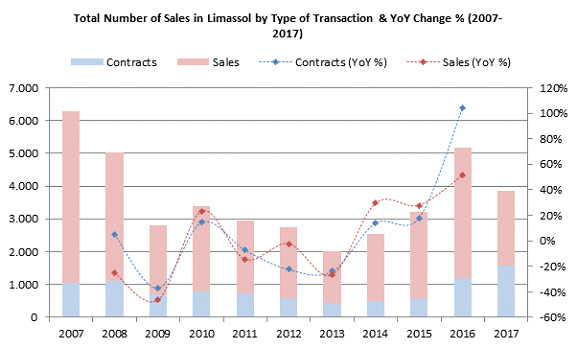
Source: Department of Lands and Surveys
For more details please contact us.
Paphos
Number of Transactions
The total transactions (including transfers and exchange of contracts) in Paphos were c.3,300 in 2016 significantly higher compared to 2015 (48%), which is a 102% increase from the lowest point of the last decade (in 2011 – c.1,650 transactions), however, still 33% lower than the peak year in 2007 (c.4,900 transactions) (the graph shows a decrease as 2017 data are do not include Q4 which is typically the best in terms of number of sales).
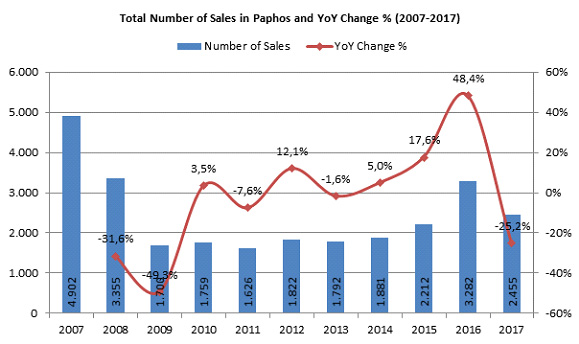
Source: Department of Lands and Surveys
The following graph (left-hand) shows the breakdown of the total transactions per quarter where we can see that, especially after 2013, Q4 is the best performing quarter of the year in terms of number of deals. The right-hand graph shows the total transactions of Q1-Q3 in each year, where we observe that Q1-Q3 in 2017 is 9% higher than the same period in 2016, which is mainly attributed to Paphos being a very popular market for foreign buyers and the fact that three of the most established integrated resorts are located here (Aphrodite Hills, Venus Rock, Minthis Hills).
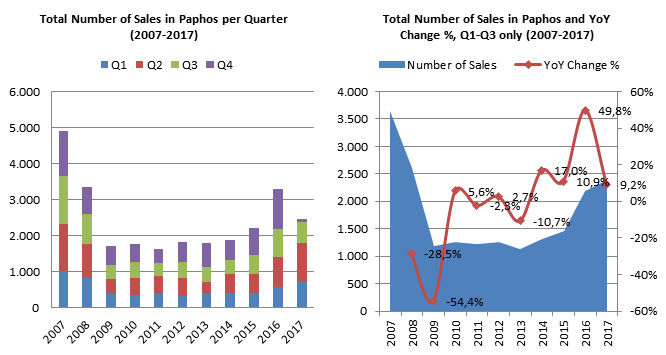
Source: Department of Lands and Surveys
Total Transactions by Transaction Type
After the bottom year of 2011, Sales show a steady increase year-on-year with significant growth after 2014. Contacts present a more volatile pattern since 2011, however, 2016 was a year of strong growth.
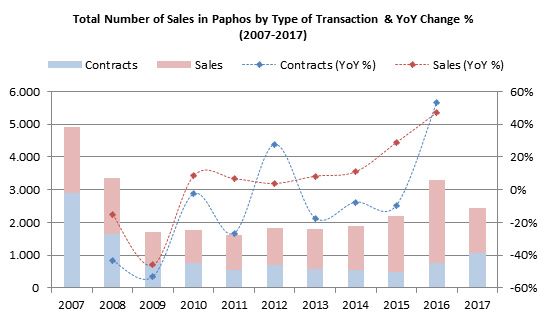
Source: Department of Lands and Surveys
For more details please contact us.
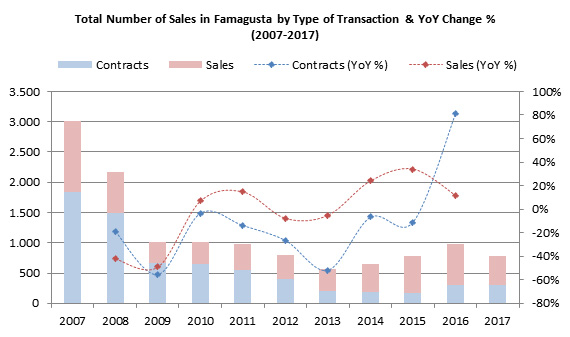
Famagusta
Number of Transactions
The total transactions (including transfers and exchange of contracts) in Famagusta were c.980 in 2016 higher compared to 2015 (26.3%), reflecting an 74% increase from the lowest point of the last decade (in 2013 – c.565 transactions), however, still 67% lower than the peak year in 2007 (c.3,000 transactions) (the graph shows a decrease as 2017 data do not include Q4 which is typically the best in terms of number of sales).
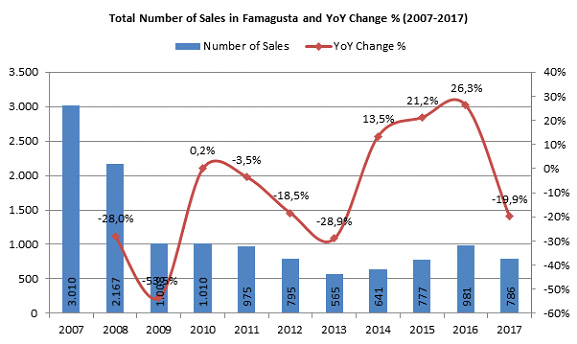
Source: Department of Lands and Surveys
The following graph (left-hand) shows the breakdown of the total transactions per quarter where we can see that, especially after 2013, Q4 is the best performing quarter of the year in terms of number of deals. The right-hand graph shows the total transactions of Q1-Q3 in each year, where we observe that Q1-Q3 in 2017 is 18% higher than the same period in 2016, showing a dynamic comeback of Famagusta.
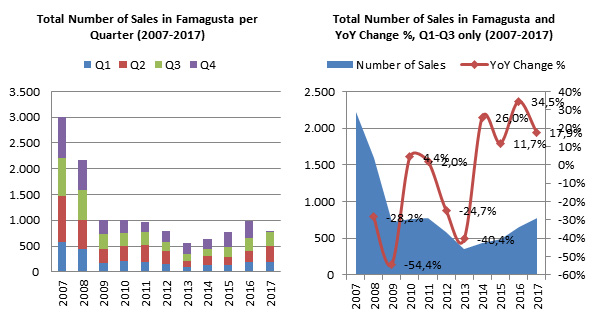
Source: Department of Lands and Surveys
Total Transactions by Transaction Type
After the bottom year of 2013, there is a significant increase of deals year on year for both Sales and Contracts. Interestingly, in 2016 there is a big increase of contracts which is mainly due to a number of new projects that came into the market (e.g. Ayia Napa Marina) as well as greater confidence in the market and the economy.
Source: Department of Lands and Surveys
For more details please contact us.
